India, often described as a land of stark contrasts, is currently at the crossroads of economic development. In this article, we delve into the key economic figures that define India’s position on the global stage. From GDP to exports, taxes, banking assets, industrial sectors, and food production, we will examine India’s standing in comparison to global giants like the USA and China.
Gross Domestic Product (GDP) is the foremost indicator of a nation’s economic strength. In 2021, the global GDP reached an impressive $96.51 trillion. While the USA stood at $23.32 trillion, China’s GDP amounted to $17.73 trillion, and India’s GDP was recorded at $3.18 trillion. With this, India makes up about 3.3% of the global GDP, a notable figure considering its historical challenges and development disparities.
India’s exports in 2021 were valued at $770.18 billion, while the USA and China reported $3,009.7 billion and $3,554.1 billion, respectively. These numbers reveal a substantial gap, with the USA’s exports being nearly four times that of India and China’s nearly five times. India needs to set ambitious targets to potentially multiply its export numbers two or three-fold over the next decade to align more closely with global figures.
In 2023, India collected approximately $270 billion in taxes. This pales in comparison to the USA’s $5 trillion in tax collections in 2022 and China’s $2.3 trillion during the same year. The stark contrast highlights the shortcomings of India’s taxation system, emphasizing the need for reforms such as the Goods and Services Tax (GST) to boost revenues.
Banking Assets: A Fraction of Global Players
The total banking assets in India in 2022 were estimated at around $2.7 trillion. Comparatively, the USA’s banking assets were approximately $23.4 trillion, and China’s, which includes foreign currency, stood at around $51 trillion. This striking disparity shows that India’s banking system is just a fraction of its global counterparts.
Oil consumption serves as an indicator of industrial activity. Globally, oil consumption reached 105 million barrels per day in 2022. The USA consumed 21 million barrels per day, China consumed 16 million, while India stood at 5.2 million barrels per day. This data reveals significant industrial activity in India, putting it on par with the ASEAN countries as a whole and making it a third of China’s consumption, although just a quarter of the USA’s.
India’s major industries include Iron & Steel, Textiles, Jute, Sugar, Cement, Paper, Petrochemicals, Automobiles, Information Technology (IT), and Banking & Insurance. In contrast, China boasts a diverse industrial landscape, encompassing mining, iron and steel, aluminum, coal, machinery, textiles, petroleum, chemicals, and much more. The contrasting sectors provide India with insights for diversification, especially in the machine products and consumer goods segments, which show high global demand.
India’s foodgrain production is estimated at 330.5 million tonnes in 2022-23. In comparison, China reported 682.9 million tonnes in 2021, while the European Union produced 297.5 million tonnes in 2021. Food grain production wise, India’s output is comparable to major regions, reflecting its agrarian strength.
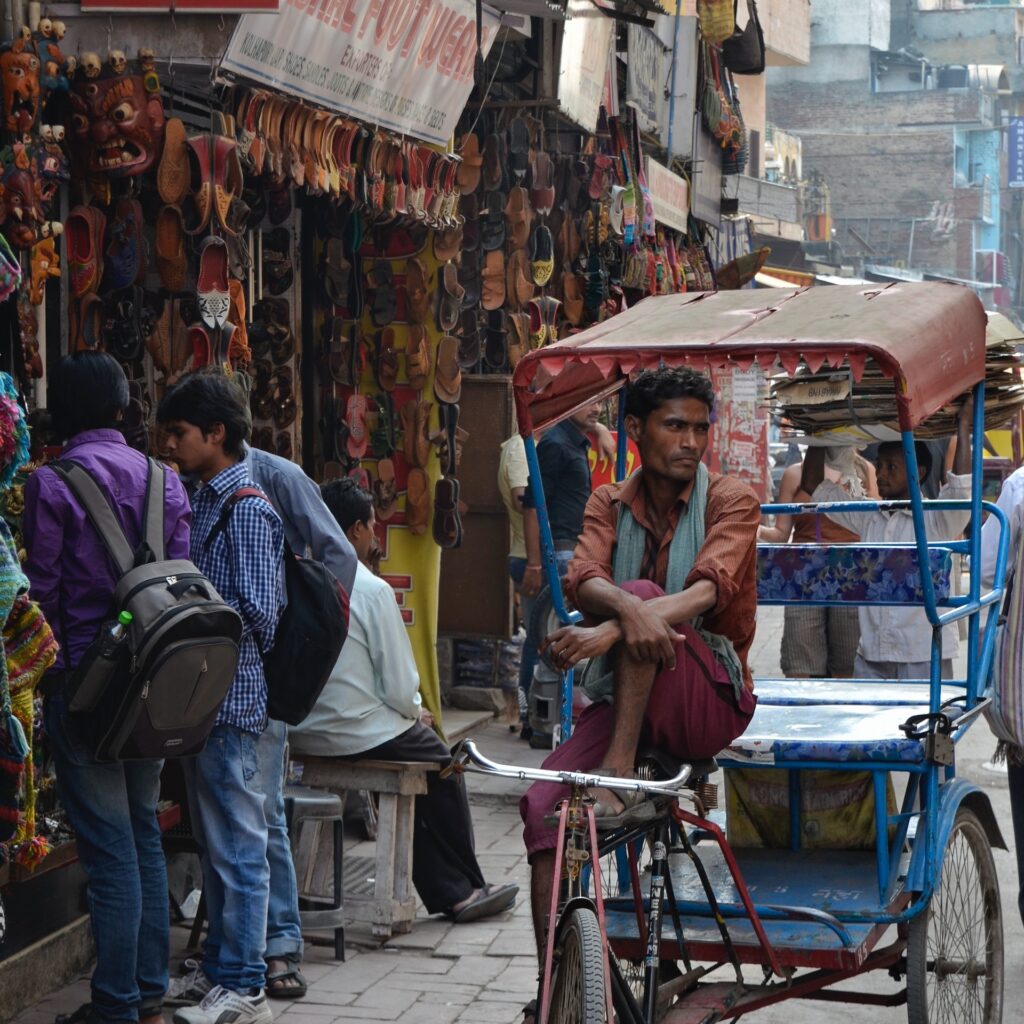
Photo by Richard McAlister: https://www.pexels.com/photo/photo-of-market-during-daytime-2780244/
India’s Steel Production Prowess
Steel, a fundamental element of various industries, plays a significant role in gauging a country’s economic strength and industrial prowess. In this article, we explore India’s remarkable position in crude steel production and its potential for even greater influence on the global stage.
India’s total crude steel production in the fiscal year 2022 reached an impressive 120.0 million tons. As the second-largest player in the world, India is only surpassed by China, which boasts a staggering 1000 million tons of crude steel production. Comparatively, the USA, another global industrial giant, produced 80 million tons of crude steel. India’s steel production figures illustrate the nation’s remarkable growth in the industry and its potential to further solidify its position in the global market.
Tourism is a potent indicator of a country’s soft power – its ability to attract visitors, investments, and cultural interest from around the world. By comparing tourism numbers with other nations, we can gain insights into India’s potential to wield soft power on the international stage.
In 2022, the USA generated an impressive $175 billion from tourism, showcasing its strong appeal as a global tourist destination. China followed closely with $108 billion in tourism revenue. Germany, Japan, and the UK generated $55 billion, $39 billion, and $33 billion, respectively.
In comparison, India generated $16 billion from tourism in 2022. While this may appear relatively modest when compared to tourism powerhouses like the USA and China, it underscores India’s untapped potential in the global tourism market. The figures suggest that India is not far behind other major players and holds substantial opportunities for growth in the tourism sector.
India’s economic status on the global stage reflects both its potential and challenges. While the nation has made significant strides in terms of GDP and industrial activity, it faces substantial disparities in areas like exports, taxation, and banking assets compared to global powerhouses like the USA and China. Recognizing these disparities and focusing on diversification and economic reforms will be key to India’s continued growth and influence on the world stage. India’s journey towards economic prowess is a dynamic process that requires thoughtful policies, investments, and strategic decisions.
Leave A Comment